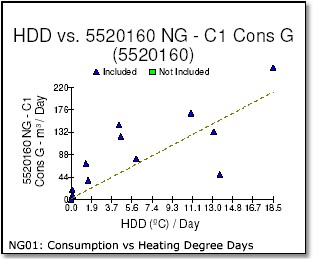
This graph, of consumption against either heating degree days or cooling degree days, shows the degree of weather sensitivity. A steep slope, like this example, shows that consumption is highly correlated to weather. Colder weather results in a very noticeable increase in natural gas consumption. A more shallow slope means that, though the consumption is affected by weather, there are end-used other than heating or cooling that are more prominent.
The closeness of the data points to the linear regression line illustrates the statistical fit of the model. A perfect fit would show the triangular data points all on the line. The R2 value would be 1.0. In this example the fit is not extremely good...there are some outlying points both above and below the line. Estimated meter readings often create outlying points.
This graph is not provided for meters that are weather-insensitive.