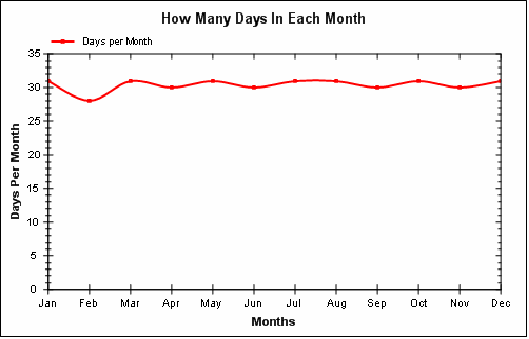
In this example we will be creating a generic chart using the classes within the ManagingEnergy.Reports.Charts namespace. The chart displays the number of days in each month along the y-axis and the month names along the x-axis.
// Create a new chart using the ZedGraph implementation Chart chart = new ZChart(500, 300);
// create a plotter which produces smooth red lines of width 2 LinePlotter plotter = new LinePlotter(Color.Red,2.0f,true);
// create the series TextSeries series = new TextSeries("Number of Days",plotter);
// add a data point for each month for (int month = 1; month <= 12; month++) { DateTime firstDayOfMonth = new DateTime(2005, month, 1); int daysInMonth = ((TimeSpan)(firstDayOfMonth.AddMonths(1) - firstDayOfMonth)).Days; series.Add(new TextSeries.TextPoint(firstDayOfMonth.ToString("MMM"),daysInMonth)); }
// add the series to the plot chart.Plot.PlotData.Add(series);
// set chart labels chart.Title = "How Many Days In Each Month"; chart.Plot.XAxisTitle = "Months"; chart.Plot.YAxisTitle = "Days Per Month"; |
Upon rendering the chart (using Chart.Draw())

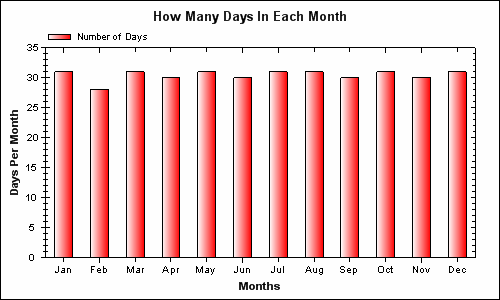
The SeriesPlotter class makes it easy to change the rending mode. For instance by changing just one line of code in the previous listing we can create a bar chart. Replacing the LinePlotter with a BarPlotter…
// create a plotter which produces red bars BarPlotter plotter = new BarPlotter(Color.Red); |
… will produce this chart using the exact same data rendered as vertical bars…

Similarly we can use the PiePlotter to render the data as a pie chart.
// create a plotter which produces a pie PiePlotter plotter = new PiePlotter(); |