The ManagingEnergy API contains a powerful charting framework that may be used to create a wide variety of charts. Currently this framework allows for the creation of three distinct types of charts, Line, Bar, and Pie.

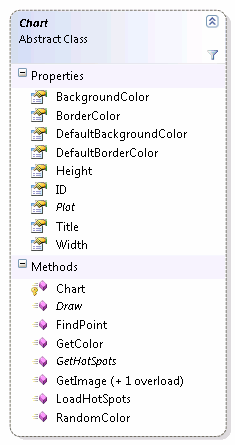
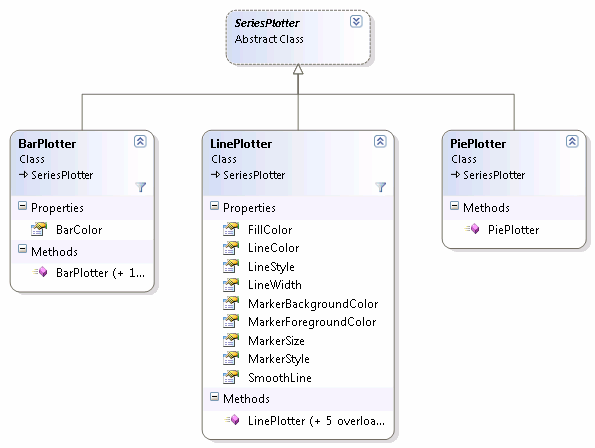
Charts are generated by first creating an instance of the Chart class. Each Chart contains an area where data is expressed in a graphical way. The Plot class represents this graphical area. Data in the form of one or more Series instances are added to the Plot prior to rendering. The SeriesPlotter associated with the Series specifies the way in which the data is displayed within a Plot. Currently the API contains three implementations of SeriesPlotter as shown below.

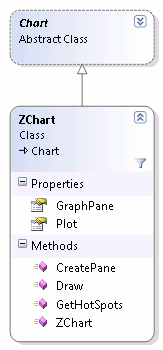
The ManagingEnergy API currently contains one implementation of the Chart class using an open source graphing API called ZedGraph [http://zedgraph.sourceforge.net/]. To use the ZedGraph implementation, create an instance of the ZChart class. To create a custom Chart drawing implementation for use with ManagingEnergy reports simply create a new sub class that extends Chart.
