|
Adapting Faser Data for Import |


|
rev. 03/02/2011

|
|
|
Adapting Faser Data for Import |
|
|
rev. 03/02/2011
|
|
Faser data exports are limited to the number of rows that a single export can handle. This means that the data may come in multiple sheets split by whichever query the client runs. E.g. The results may need to be run by year, and in multiple parts.
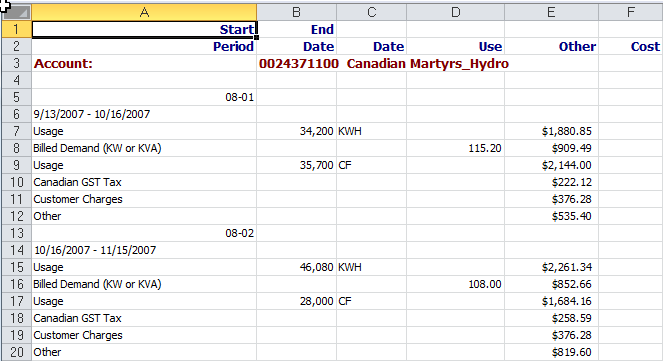
Example of data export directly from Faser.
Adam has created a program that will convert this data to a format more closely related to the format required for import into ManagingEnergy.
At the time this topic is being created, Adam's program will only parse the data if it is arranged in a way where all data for an account is arranged under a single heading. In the case of data which has been exported from Faser by year, this means that the data has to be combined under a single heading. This can involve a great deal of cutting and pasting. If we win a job where we will need to import Faser data to start, I would recommend that this program be altered so that multiple headings are possible. in this way, we would only have to paste the pages together and run them through the program, thereby saving a great deal of time and effort. If the program can be altered to also arrange column headings alphabetically, it would ease the compiling of data into the tariffs as described in the next paragraph.
Once the data has been run through the program, the newly created export still needs to be modified to arrange the information into tariff groups by provider. This may involve cross referencing the accounts with what exists in ManagingEnergy, or with a list that references accounts and providers. The information should be grouped by provider, utility type, and/or unit of measure in order to create logical tariffs with the data. Each tariff should have its own sheet within the workbook.
In some cases, creating tariff groups may involve combining output sheets with slightly different columns. For example, some invoices may have been entered with the same basic consumption charges and information, but there will be additional charges such as rentals that only apply to a few invoices from the same provider. In these cases combining the two sets of data and leaving the rental column blank for invoices that don't have rentals would allow for fewer tariffs to be created, thereby simplifying the import process.
There appears to be limited data available from Faser in comparison to the information that is regularly input into ManagingEnergy. As such, the tariffs at this stage are going to be very simple. They will involve listing off various costs, and creating a calculated total component.
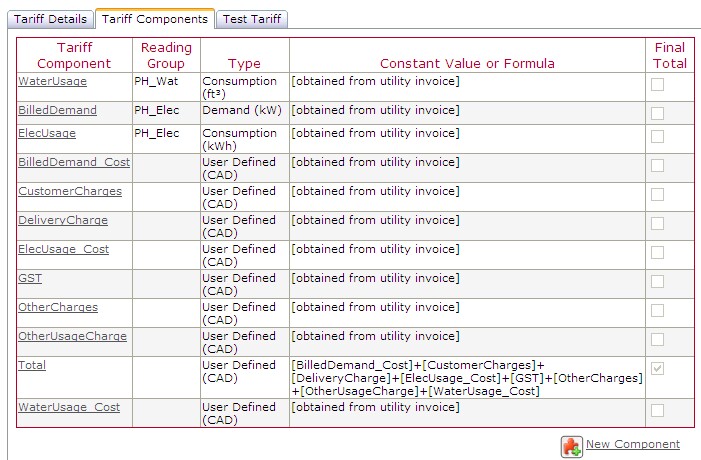
Example Faser tariff, listing various charges as components, as well as a calculated total.
This process by necessity is fairly labour intensive. Due to the fact that tariffs from a single provider could be split across pages in Adam's output owing to a variety of miscellaneous charges, there needs to be a certain amount of human intervention to make sure they are combined effectively. Time should be allotted to allow for this in quotations for this sort of work.
Importing the data should be the same as with other exports. Many of the dashboards and reports may not appear correct for this data, as there is not enough information to provide the detail that would be seen with data imported expressly by ManagingEnergy. This historical data will allow the client to continue to use the data for reference.
Different tariffs will need to be created in order to import new and future data from providers. This will allow for better detail and more effective use of ManagingEnergy in the future for our clients.