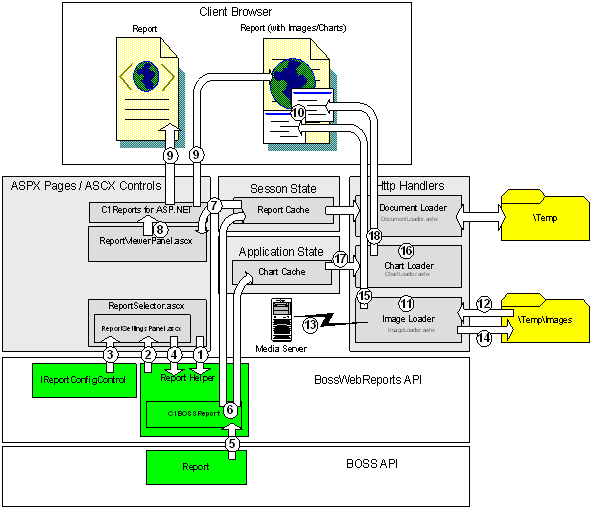
The following is an overview of the steps involved within the process of serving a report-viewing request.

| 1) | When a user clicks on one of the report links within the report selector, the selected ReportCategory, ReportGroup, and ReportLink objects are passed to the ReportHelper’s ReportSettingsControlPath method. |
| 2) | If a custom report settings control exists for the selected report, the ReportSettingsControlPath returns the path to the ascx control file which should be displayed to the user. If the report does not have a custom settings control, returning null from this method will prevent displaying custom report settings (see step 4). Note: All custom report settings controls must implement the IReportSettingsControl interface. |
| 3) | The custom settings control file path is used to dynamically load the control at runtime. The user is then able to select their desired settings for the report. When the user clicks the accept button, the custom settings control attempts to validate the selected settings. If the currently selected settings are not valid the user is prompted to modify their selection. |
| 4) | The CreateReport method of ReportHelper is called. The report tag is then compared to determine which report the user is trying to create. |
| 5) | The Report associated with the report tag is created and then combined with the C1 report definition xml (using the C1ManagingEnergyReport class). This produces a ComponentOne specific implementation of the selected ManagingEnergy report. |
| 6) | The Report is then added to the ReportCache. Any Chart instances within the report are added to the ChartCache. Chart objects will remain in the ChartCache as long as their parent Report exists in the ReportCache. When a Report is no longer being viewed it is removed from the ReportCache. |
| 7) | The report viewer panel retrieves the Report from the ReportCache. |
| 8) | The ASP.NET C1Report control is used to render the Report. |
| 9) | The output from C1Report control is sent to the client’s browser. This report may contain references to embedded images/charts. |
| 10) | If the report does contain references to images/charts. The browser will send a request to the respective HTTP handler associated with the media. |
| 11) | The ImageLoader HTTP handler receives the HTTP request for an image. |
| 12) | The ImageLoader attempts to retrieve a previously cached version of the requested image. |
| 13) | If the image is not located in the cache, the ImageLoader uses the network path specified within the report, to download the image from the Media Server. |
| 14) | Sizing transformations are applied to the image and the result is cached within the \Temp\Images directory. Any future request for the image will use the cached version. Every 60 minutes the image cache is cleared hence erasing all previously cached images. |
| 15) | The image data is sent to the client’s browser. |
| 16) | The ChartLoader HTTP handler receives the HTTP request for a chart. |
| 17) | The requested Chart is retrieved from the ChartCache. Sizing transformations are applied and an image of the chart is generated. |
| 18) | The image is then sent to the client’s browser. |
7.1.2_Report_Viewing_Process
©2017 Managing Energy Inc.
